Icarus and GtkWave/drom Quickstart #
This tutorial covers the basics of how to use the icarus verilog simulator and GTKWave waveform viewer.
Github Link #
Counter Module #
Let’s make a super simple module, called counter.v.
Inputs:
- clock
- reset
Outputs
- count
The output will increment by +1 on each clock. The counter will be 4 bits wide and will rollover at 15.
counter.v #
module count_up(clk, reset, count);
input clk;
input reset;
output [3:0] count;
reg [3:0] counter;

always @(posedge clk)
begin
    if(reset)
        counter <= 0;
    else
        counter <= counter + 1;
end

assign count = counter;

// Dump waves
initial begin
    $dumpfile("dump.vcd");
    $dumpvars(1, count_up);
end
endmodule
For compatibility with gtkwave, you must include the last few lines at the end of any verilog module you’d like to view:
initial begin
    $dumpfile("dump.vcd");
    $dumpvars(1, count_up);
end
These lines create a value change dump file of the simulators output.
Writing A Verilog Testbench #
count_up_tb.v #
module count_up_tb();
wire [3:0] count;
reg clk,reset;
count_up DUT(.clk(clk),.reset(reset),.count(count));

//create clock
initial begin
    clk = 0;
    forever #5 clk = ~clk;
end

initial begin
    $dumpfile("testbench.vcd");
    $dumpvars(0,DUT);
    reset = 0;
    #5
    reset = 1;
    #5
    reset = 0;
    #15
    reset = 1;
    #5
    reset = 0;
    #200 $finish;
end

endmodule
Running Testbench With Icarus #
Let’s run the testbench to get a feel for using icarus. When using Cocotb later on much of the calls to the simulator are obfuscated away, making life easier for us, but its good to know whats going on under the hood.
> iverilog -o count_up_output count_up.v count_up_tb.v
> vvp count_up
The first command calls iverilog, which is a compiler that translates Verilog source code into executable programs for simulation. We then run vvp for simulation.
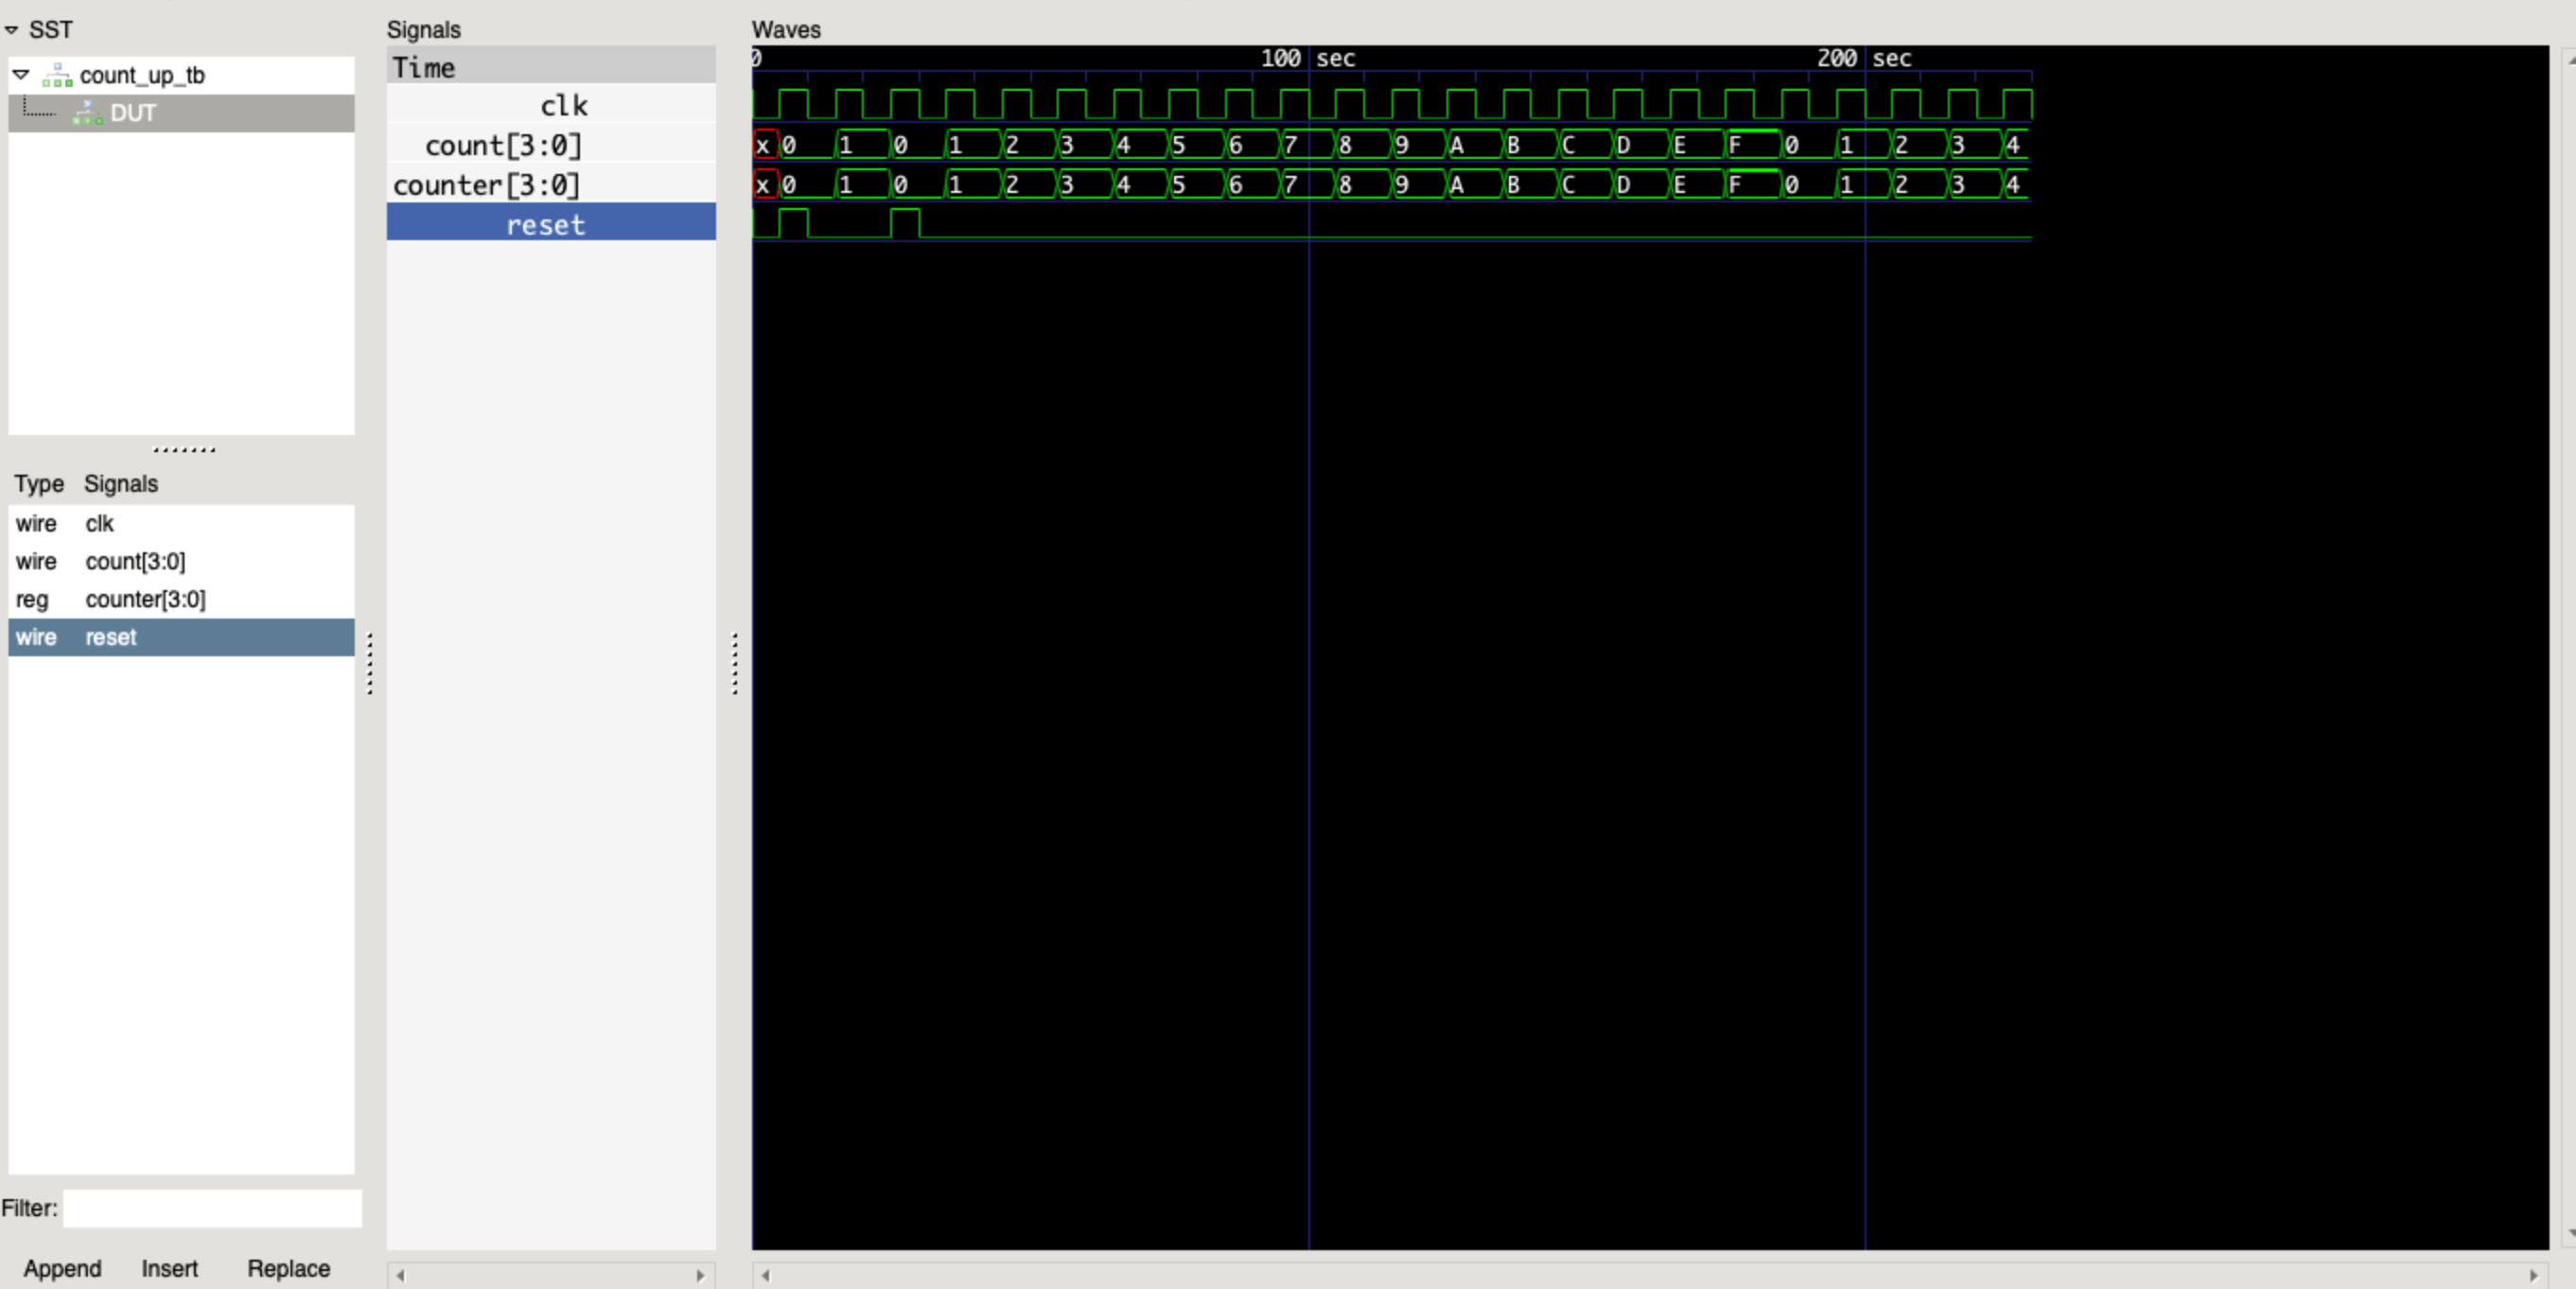
viewing results in gtkwave #
In the previous step vvp ran our simulation and placed the results in the count_up_output file. Our testbench drove our verilog module which dumped the signals to testbench.vcd (note: in count_up_tb.v we asked it to dump our variables to this file). This file can be opened in gtkwave. Steps:
- Open gtkwave
- navigate to file -> open new waveform
- open the
testbench.vcdfile - in the left side pane select DUT and then click on the signals below to add to waveform
viewing results in vc.drom.io #
Simply drag and drop testbench.vcd to vc.drom.io
EDA Playground Link to Example #
you can view and run this example in a browser at eda playground